A project can look busy, productive and even successful on the surface, while quietly heading towards a profitability problem.
That is why keeping an eye on project health means looking beyond whether tasks are being completed and deadlines are being met. Financial performance matters too.
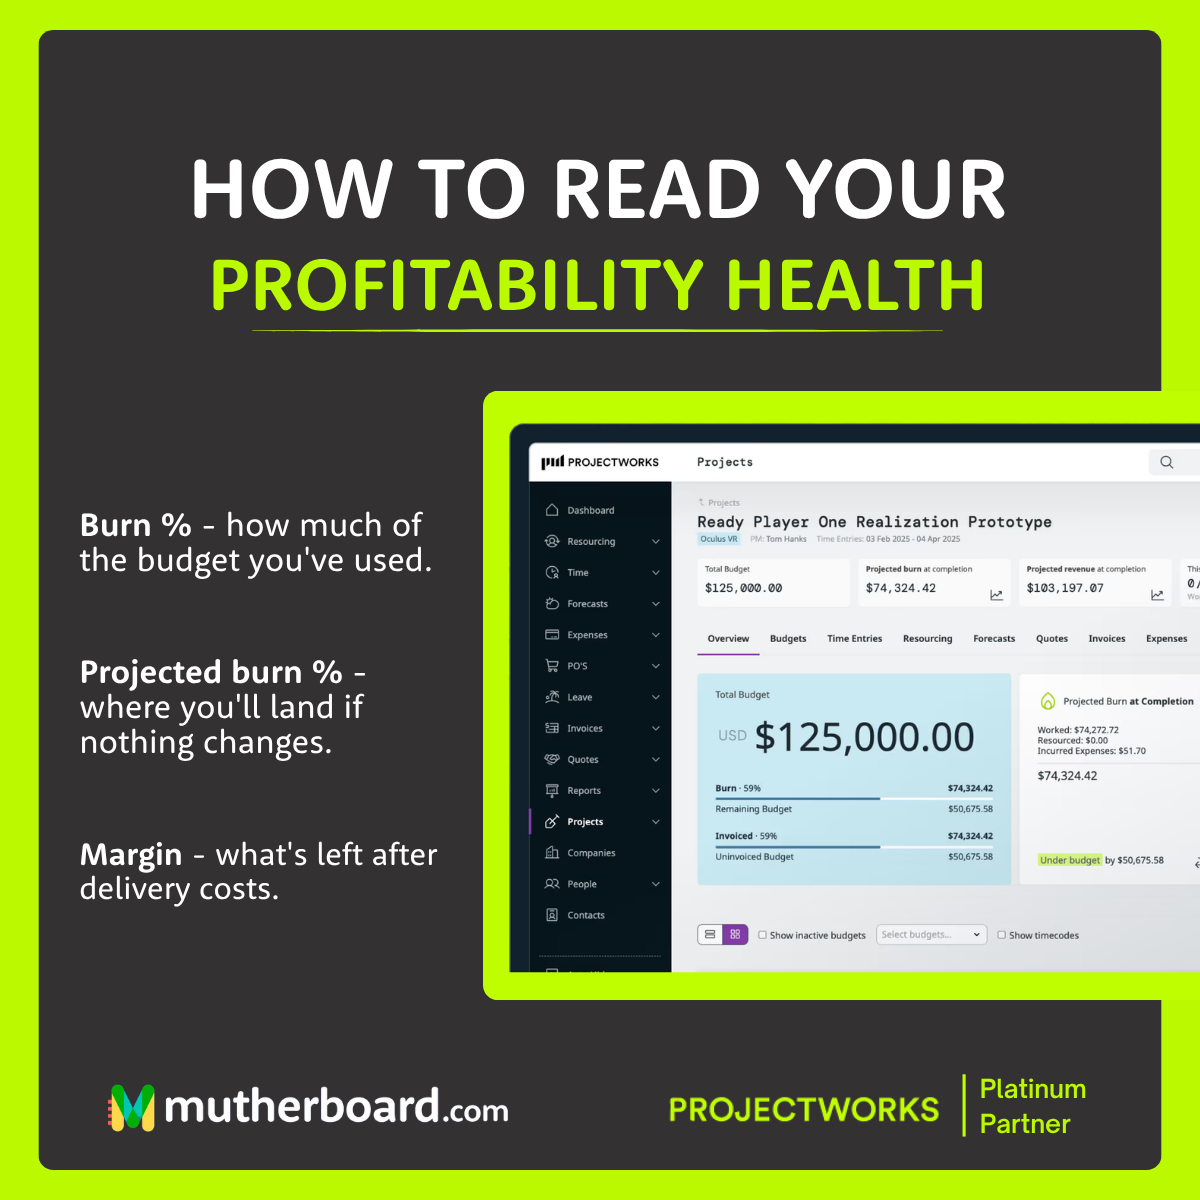
Three metrics can give you a much clearer picture of where a project stands: Burn %, Projected Burn %, and Margin.
Burn %: How much of the budget have you used?
Burn % shows how much of your project budget has already been consumed.
This gives you a quick snapshot of current spending and helps answer a simple but important question: Are we spending at the rate we expected to?
A high burn percentage is not automatically a problem. If a project is 80% complete and has used 80% of its budget, things may be perfectly on track.
The trouble starts when progress and spending become disconnected. If you've used 80% of the budget but only completed 50% of the work, it might be time to investigate.
Projected Burn %: Where are you heading?
Current numbers are useful, but they only tell you part of the story.
Projected Burn % looks ahead and estimates where your project will land if things continue as they are.
This is where project profitability becomes proactive rather than reactive.
Instead of discovering at the end of a project that the budget has disappeared, you can spot potential issues while there is still time to do something about them. Perhaps the project needs additional budget, resources need to be allocated differently, or scope needs to be reviewed.
The earlier you can see a problem coming, the more options you have.
Margin: What is actually left?
Margin looks at what remains after delivery costs.
For professional services businesses, this is a particularly important number. Winning projects and keeping teams busy is great, but if those projects consistently deliver lower margins than expected, the business can quickly run into trouble.
Understanding margin at a project level helps teams make better decisions around resourcing, pricing and delivery.
It also helps answer a question that can sometimes get lost amongst timesheets, deadlines and task lists: Is this project actually profitable?
Why visibility matters
The biggest challenge is often not the lack of data. Most businesses have plenty of it.
The challenge is having that information visible, understandable and available at the right time.
When project managers and leadership teams can see Burn %, Projected Burn % and Margin in one place, they can make decisions based on where a project is now and where it is likely to end up.
Because finding out that a project went over budget once all the work is complete is a bit like checking the weather after you've been caught in the rain. You know what happened, but there is not much you can do about it.
A healthier approach is to monitor profitability throughout the project lifecycle.
With the right visibility, you can spot risks earlier, make informed decisions and keep projects financially healthy from start to finish.
After all, successful delivery should not just mean getting the work done. It should mean getting the work done profitably.